
In maths, I have recently been studying the strength and types of correlation between two sets of data. Due to this and spending large proportions of my recent free time playing Jurassic World Evolution 3, I decided to investigate the relationship between different stats of the dinosaurs in the game.
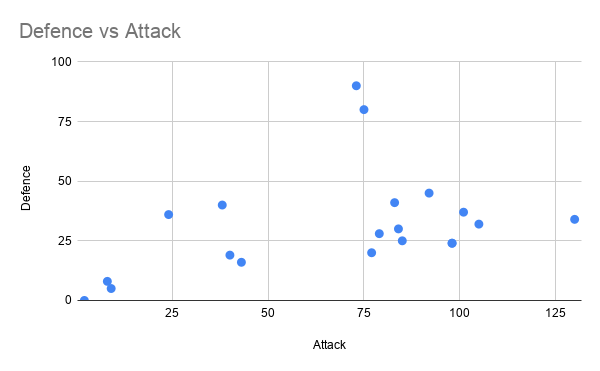
As shown by the chart on the left, there appears to be no correlation between the attack and defence stats of dinosaurs.
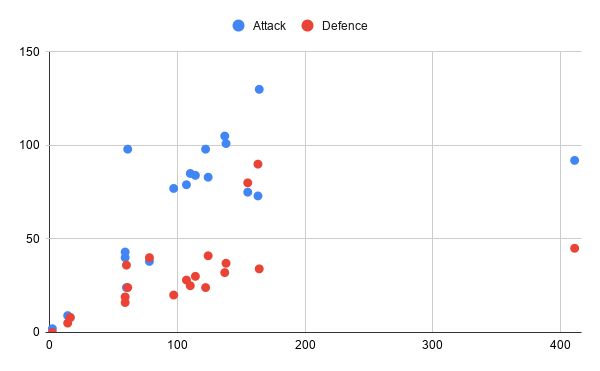
As dominance (the x axis) increases, the attack and defence stats of the dinosaur increases. If the main anomaly of attack and defence stats (the two points on the right edge of the graph) are ignored, the attack stat shows a strong positive correlation and directly proportional relationship with the dominance. Meanwhile, the positive linear relationship between defence and dominance displays a fairly strong positive correlation.
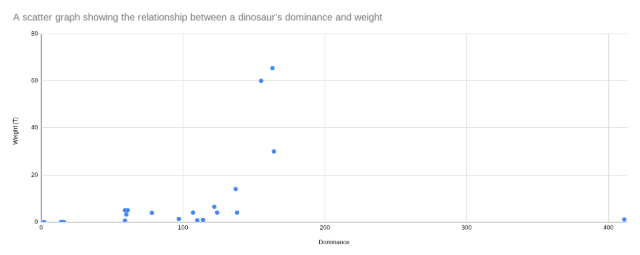
There appears to be no correlation between a dinosaur’s weight and the percentage of the area it requires that is supplied by a 1×1 fence enclosure.
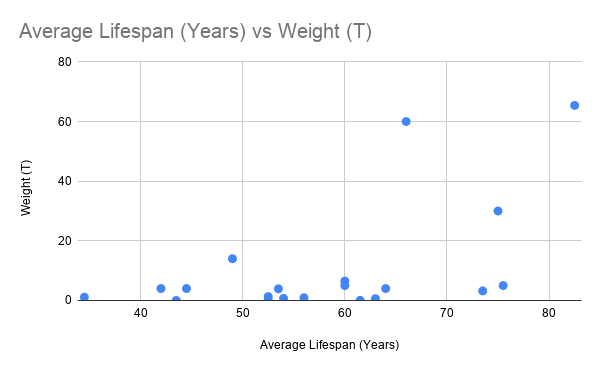
There is also zero correlation between the average lifespan of a dinosaur and its weight.
`
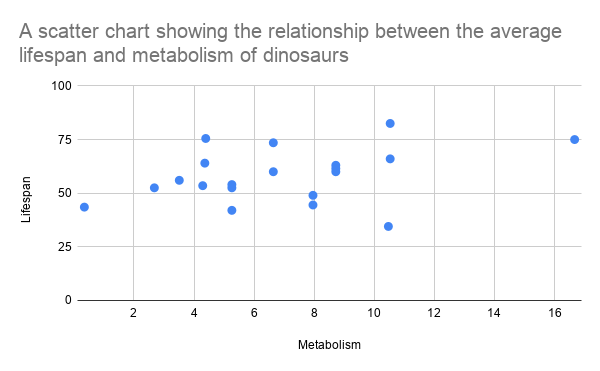
There is not any correlation between a dinosaur’s metabolism and average lifespan.
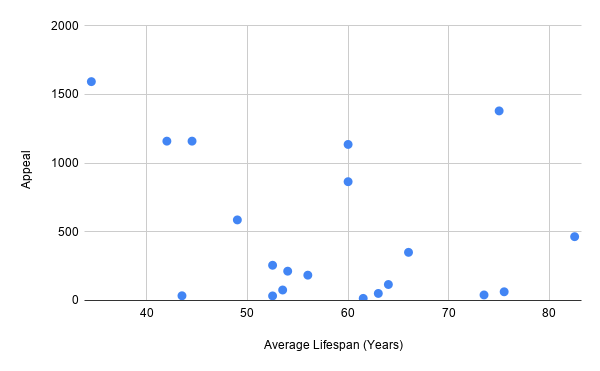
This graph of dinosaurs’average lifespan and appeal displays no correlation between the two stats.
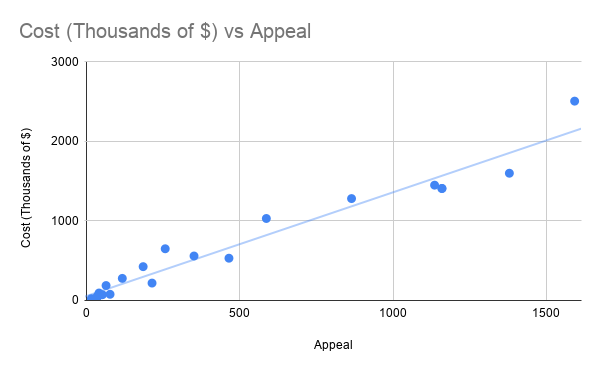
As shown by this graph and its line of best fit, there is a strong positive correlation between a dinosaur’s appeal and how much it costs to synthesise it. This relationship is also directly proportional.
From all of these graphs, only one relationship surprised me. This was the no correlation between the weight of dinosaurs and the percentage of their required area supplied by a 1×1 fence. Instead of no correlation, I expected the graph to show negative correlation with the percentage of a creature’s required area provided by the enclosure decreasing as the weight increased.