Today, we finished the weather station project. This post is about all the changes made since the last weather station post.

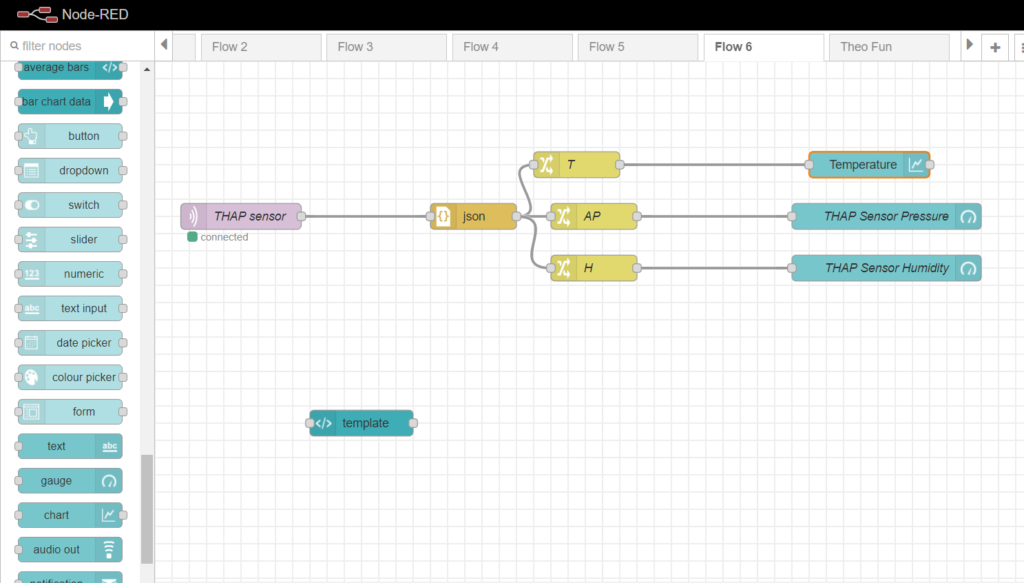
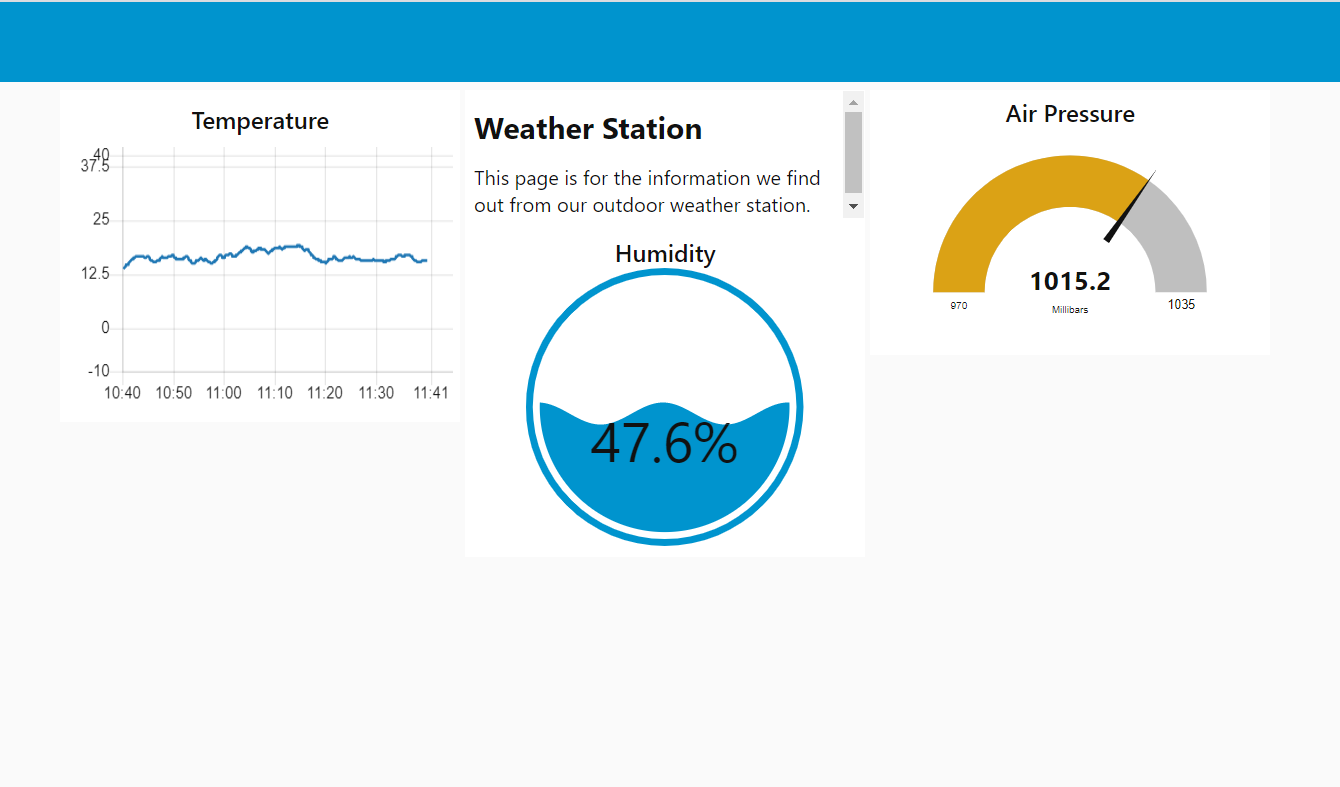
First, we added 3 change nodes to the flow to select which piece of information we wanted from the message we received from the MQTT broker. Then, we swapped the debug node for a chart node and a gauge node, to show the temperature and air pressure. The chart made by the chart node goes wherever we want it on the Node-Red Dashboard. This is the same for the gauge node, but it gives you the gauge you selected. Next, we added the level gauge node for the humidity. Finally, we added a template node.

The template node lets you set up a page on the dashboard using HTML. HTML is very important in coding web pages. I used the HTML to add a title and paragraph to the page.

